
Walsh Pure Technicals - Pure Hedge Division
Jon Wiedeman 9/16/2025
If you would like to receive more information on the commodity markets or would like to open an account, please click the link Sign Up Now
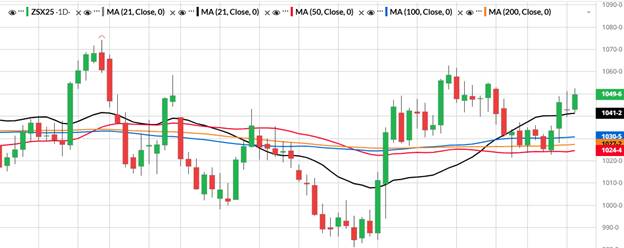
Daily ZSX5:
November beans closed the day higher and currently are trading above the moving averages and settled just below the 1050 price. The last time November beans have settled above 1050 was at the end of August. For current resistance on the daily charts, I am using 1055 and then 1062 ¾ followed by 1074 ¼. As far as support goes, we have the 21- and 14-day moving averages at 1041 ¼. The 100-day moving average comes in as support at 1030 ½. (see chart below).
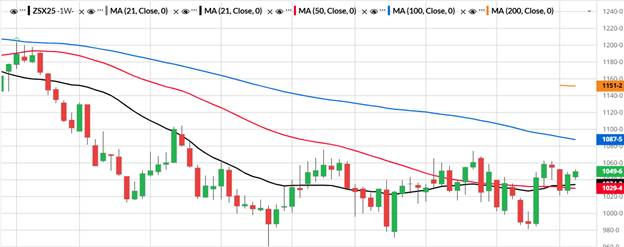
Weekly ZSX5:
Looking at the weekly charts for November beans we have resistance at 1062 ¾ which was the month of August’s high and then followed by 1074 ¼. For support I am using 1029 ½ which is the 50-day moving average on the weekly charts. (see chart below).
Fundamentals:
Soybeans continue to trade higher with South America still being more expensive that the US which should bring some demand back towards the US. Obviously, China is still absent from purchasing any of our soybeans but there are talks that President Trump is going to have talks with China on Friday. Soybeans crop conditions dropped 1% to 63% good to excellent which was 64% last year. US harvest is now reported at 5% completed compared to 3% on average.
Trade Ideas:
Long the 1050-1100 call spread in November beans for 10 cents.
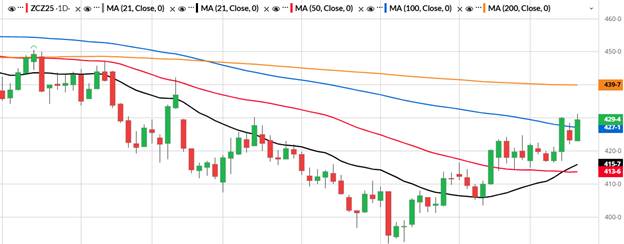
Daily ZCZ5:
December corn traded higher up to 431 ¼ making a new high for the recent move. Current resistance for Dec corn is 432 ¾ which was a gap going back to July 3rd and then the 200-day moving average which is 439 ¾. The last time corn traded above the 200-day moving average was the beginning of June where corn was back around 450. For support I am using 416 and 413 ¾ which is currently the 50-day moving average. (see chart below).
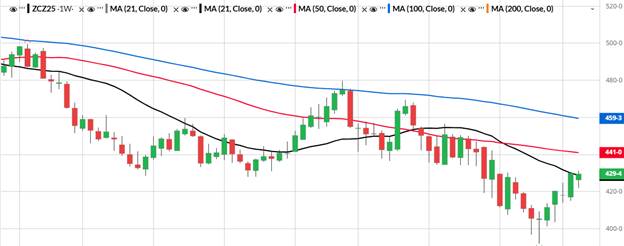
Weekly ZCZ5:
Looking at the weekly charts for December corn we have resistance at 441 which is the 50-day moving average. For support I am using 415 which was last week’s low. (see chart below).
Fundamentals:
With harvest pressure quickly approaching we will see how the market acts to a record corn crop about to be harvested. Corn crop conditions dropped 1% in the good to excellent category which is now 67%. Corn harvested is also 7% complete as of Sunday.
Trade Ideas:
Long the December 410-450 call spread for 8½ cents.
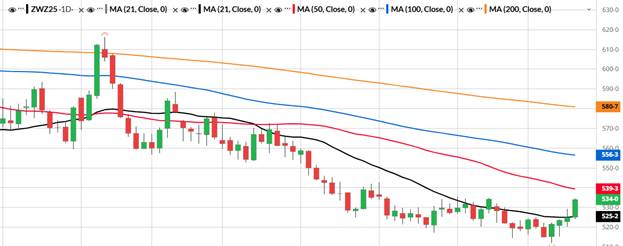
Daily ZWZ5:
December wheat closed higher on the day to mark its 4th consecutive close higher and settled above 530. For resistance in December wheat on the daily charts I am using 539 ¼ which is the 50-day moving average. For support I am using 520. (see chart below).
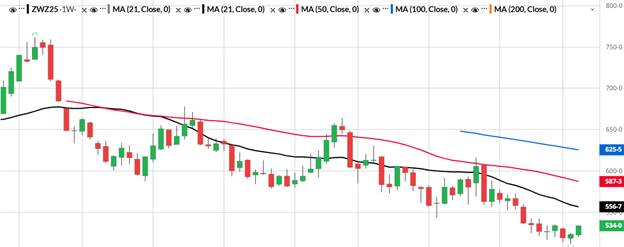
Weekly ZWZ5:
Looking at the weekly charts for December wheat, we have resistance at 556 ¾ which is both the 21- and 14-day moving average and for support the contract low of 512. (see chart below).
Fundamentals:
With the abundance of world wheat and a lot of bearish news thrown at the wheat market it looks to have made a temporary low with some short covering as well as technical buying which has appeared. The weak US dollar has also helped the wheat rally as of late.
Trade Ideas:
Long the 530 – 570 Dec call spread for 9 cents.
If you would like to receive more information on the commodity markets or would like to open an account, please click the link Sign Up Now

Jon Wiedeman
Pure Hedge Division
Direct: 1 312 957 8108
WALSH TRADING INC.
311 S. Wacker Suite 540
Chicago, Illinois 60606
Walsh Trading, Inc. is registered as a Guaranteed Introducing Broker with the Commodity Futures Trading Commission and an NFA Member.
Futures and options trading involves substantial risk and is not suitable for all investors. Therefore, individuals should carefully consider their financial condition in deciding whether to trade. Option traders should be aware that the exercise of a long option will result in a futures position. The valuation of futures and options may fluctuate, and as a result, clients may lose more than their original investment. The information contained on this site is the opinion of the writer or was obtained from sources cited within the commentary. The impact on market prices due to seasonal or market cycles and current news events may already be reflected in market prices. PAST PERFORMANCE IS NOT NECESSARILY INDICATIVE OF FUTURE RESULTS.
All information, communications, publications, and reports, including this specific material, used and distributed by Walsh Trading, Inc. (“WTI”) shall be construed as a solicitation for entering into a derivatives transaction. WTI does not distribute research reports, employ research analysts, or maintain a research department as defined in CFTC Regulation 1.71.